Monthly View - May 2024
Global share markets pull back after reaching historical highs
After a strong start to the year, with many markets reaching historical highs during March, global share markets fell during April. Higher interest rates, following stronger than expected US inflation and ongoing strength in the US economy, and rising geo-political risks in the Middle East negatively impacted global markets over the month.
Global share markets fell [1] -1.8% in April and are up 21.0% over the last six months.
Global Equities
In April the US first quarter’s corporate earnings season commenced. By the end of April 80% of S&P 500 companies had reported their earnings, and of those 77% have delivered positive earnings surprises, against an historic norm of 76%. Earnings growth expectations for the quarter have increased to 8.3% year-on-year, which is up from 4.1% expected growth at the beginning of the earnings season. US corporate earnings are expected to grow +10% over 2024.
Encouragingly there is growing evidence of a broadening of earnings growth outside of US large cap tech stocks (by way of example, companies such as General Motors, Goldman Sachs, and Colgate Palmolive performed strongly following their earnings announcements).
Within the large US cap tech stocks, (the Magnificent Seven of Amazon, Apple, Meta Platforms ( Facebook), Microsoft, Google parent Alphabet, Nvidia, and Tesla) there has been a divergence in performance and earnings outcomes. Despite recent gains, Tesla and Apple have struggled relative to peers in 2024. Meta fell after announcing its profit results on weaker than expected revenues and concerns over the level of capital expenditure required to deliver future earnings from its artificial intelligence strategy. Microsoft and Alphabet delivered positive earnings surprises. Shares in Alphabet soared 10% to a record high following its earnings announcement, resulting in the company being valued at over US$2 trillion. Amazon also topped estimates.
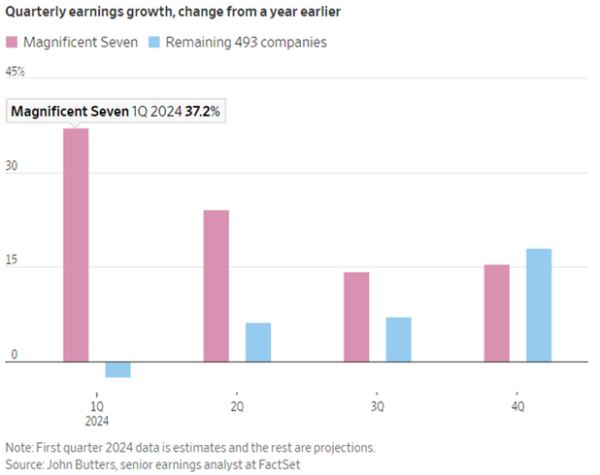
As the year progresses the year-on-year growth in earnings of the S&P 500 companies outside the Magnificent Seven is expected to be greater than that of the Magnificent Seven (as highlighted in the graph below). This is expected to see a broadening of market leadership as the year develops.
For the time being, and importantly for global financial markets, overall US big tech names are meeting market expectations.
Crucially for US corporate earnings, the US economy remains resilient. Although growth is slowing from the robust pace over the final six months of last year, currently the prospect of America experiencing recession is at its lowest level in two years. Globally, recent economic growth has been firmer than anticipated. Chinese economic activity over the first quarter of 2024 beat expectations, expanding at a 5.3% year-on-year rate. The eurozone economy grew faster than forecast in the first quarter of this year. Eurozone gross domestic product expanded at a quarterly rate of 0.3% in the first three months of the year, whereas economists had forecast 0.1% growth. That is its fastest rate since the third quarter of 2022 and an improvement from a contraction of 0.1% in the final quarter of last year.
A pickup in corporate activity is also providing support for global stocks. The most recent example is Sony Pictures and Apollo Global Management (a private equity business) making a US$26 billion offer for the troubled media giant Paramount. Paramount’s assets include Paramount Pictures, CBS, MTV, the UK’s Channel 5 and Australia’s Channel Ten. The movie studio’s blockbuster hits include the Mission: Impossible franchise and The Godfather.
Corporate share buybacks are another theme helping support share markets. As part of its earnings update Apple announced it would be buying back US$110 billion of its shares. This is a 22% increase on last year’s $90 billion share buyback program. To place this into perspective, the current market value of the New Zealand share market is NZ$164 billion, equivalent to US$98 billion.
Australasian Equities
New Zealand’s share market [2] fell -1.2% in April, primarily on global events. Local issues also weighed on the market, including rising longer-term interest rates and measures of domestic economic activity weakening. For example, the BNZ-Business NZ Performance of Services Index slumped to 47.5 in April from 52.6 in March. Apart from during Covid, this is the worst reading since 2009.
In company news, F&P Healthcare rose 11.0% on optimism for future earnings. Tower rose 18.0% after it provided its second earnings upgrade in recent months on improved operational performance. Air New Zealand fell -9.1% after it downgraded its earnings outlook due to “deteriorating market conditions”, partly reflecting increased competition on its North American routes. Heartland Bank fell 15.2% after it announced a NZ$200 million equity raise to support its purchase of Australia’s Challenger Bank.
Australian equities fell -2.9% [3] in April on global equity market weakness, rising domestic interest rates, and weaker than anticipated economic data (e.g., employment data and retail sales have been softer than expected). Consistent with the global theme of rising corporate activity, BHP made a tentative $60 billion bid for Anglo-American, a UK/South African mining company with attractive copper assets. The bid has been rejected but did help other mining / resources companies over the month e.g., South 32 returned 19.7%. Newmont, a gold producing company, rose 18.6% in April after a 16.8% gain in March on a better-than-expected profit update, benefiting from the recent rise in the gold price. Gold reached new highs in April ($2,330 an ounce). Interest rate sensitive sectors, such as property, underperformed during the month. The Australian property index fell 7.8%, and Charter Hall (-12.8%), and Mirvac (-12.7%) were amongst the worst performing stocks.
Fixed income and cash markets
Longer-term global interest rates rose to fresh highs for the year in many countries, pushed higher by the US market as investors reset their expectations for the timing of interest rate cuts by the US Federal Reserve (Fed). The US 10-year government bond yield rose 48 basis points (0.48%) to 4.68% over the month. The Bloomberg Global Aggregate Bond Index (New Zealand dollar hedged) fell -1.6% in April.
US headline inflation rose 3.5% from a year earlier, which was a touch higher than economists had forecasted and a pickup from February’s 3.2%. Though the annual increase in US consumer prices has declined from a peak of 9.1% in June 2022, the disinflationary trend has stalled in recent months. March’s inflation outcome was the third consecutive month of stronger-than-anticipated inflation readings.
The US inflation data, along with strong US employment and retail sales data in April, drove the change in expectations as to when the Fed will commence cutting interest rates. This pushed global longer-term interest rates higher.
At its most recent meeting the Fed left the benchmark Fed Funds Rate in a range between 5.25% and 5.5% as widely anticipated. The Fed has maintained the Fed Funds Rate at this level for nine months. For the time being the Fed will maintain interest rates at current levels. For the Fed to commence interest rate reductions it will want to see further progress on an easing in inflation pressures, softer US economic data, and further labour market easing.
New Zealand’s longer-term interest rates drifted higher on global events, sticky non-tradables inflation (non-tradables inflation covers goods and services that do not face foreign competition e.g., rates, insurance, and rents), and despite soft domestic economic data. Although New Zealand’s annual inflation rate fell to 4.0% over the March quarter from 4.7% at the end of 2023, non-tradables inflation hardly moved, coming in at 5.8% compared to 5.9% in December 2023. The local fixed income market [4] fell -1.0% for the month.
Conclusion
Despite recent market volatility, expectations remain for inflation to continue to trend lower over the year ahead and central banks will likely commence interest rate reductions as a result.
Meanwhile, the ongoing resilience of the US economy is supportive of US corporate earnings, and global economic activity is stabilising. In the US, as the year progresses companies outside of the Magnificent Seven will make an increasing contribution to market earnings growth. This leads to the prospect of a broader group of companies supporting the market. Risks remain around the US recession and ongoing geo-political risks.
Fixed income offers an attractive yield with the potential for capital gains from declines in interest rates. Longer term interest rates are forecasted to decline over the next twelve months, given expectations that inflation will continue to ease and that central banks will commence interest rate reductions. The ongoing weakness in the local economy will place downward pressure on domestic inflation, allowing the RBNZ to commence interest rate cuts. Potentially these could occur earlier than the first half of 2025 as currently anticipated by the Bank. In this environment, short dated fixed term securities, such as term deposits, are likely to underperform longer-dated securities.
Focusing on your long-term goals while acknowledging that in the short-term, returns may be volatile, should reward investors.
1 MSCI ACWI Index in local currencies
2 S&P NZX 50 gross index
3 S&P ASX 200 total return Index
4 Bloomberg NZ Bond Composite 0+ Yr Index
Indices for Key Markets
| As at 30 April 2024 | 1 Month | 3 Months | 6 Months | 1 Year | 3 Years p.a. | 5 Years p.a. |
| S&P/NZX 50 Index | -1.2% | 1.0% | 11.6% | 0.4% | -1.3% | 4.4% |
| S&P/ASX 200 Index (AUD) | -2.9% | 1.0% | 15.2% | 9.1% | 7.3% | 8.0% |
| MSCI ACWI Index (Local Currency) | -1.8% | 6.3% | 21.0% | 20.6% | 6.6% | 10.5% |
| MSCI ACWI Index (NZD) | -12.1% | 8.1% | 17.9% | 23.0% | 11.2% | 12.2% |
| S&P/NZX 90 Day bank bill Total Return | 0.5% | 1.4% | 2.8% | 5.8% | 3.3% | 2.3% |
If you have any questions please contact us on +64 9 308 1450
Information and Disclaimer: This report is for information purposes only. It does not take into account your investment needs or personal circumstances and so is not intended to be viewed as investment or financial advice. Should you require financial advice you should always speak to your Financial Adviser. This report has been prepared from published information and other sources believed to be reliable, accurate and complete at the time of preparation. While every effort has been made to ensure accuracy neither JMI Wealth, nor any person involved in this publication, accept any liability for any errors or omission, nor accepts liability for loss or damage as a result of any reliance on the information presented.