Monthly View - October 2024
Market finishes the quarter strongly
The global central bank interest rate easing cycle gathered pace over September, resulting in a continuation of strong returns from fixed income and global sharemarkets.
Global Equities
Global sharemarkets rose [1] 2.0% in September and are up 5.0% and 30.0% over the last three and twelve months respectively.
Seasonal volatility remained in global equity markets, with a weekly 4.0% decline in the US S&P 500 index followed by a 4.0% gain. September has historically been a volatile month. Global equity markets gained late in the month on lower interest rates. During September the US S&P 500 index hit its 42nd record high for the year and is up 36% year-over-year. European sharemarkets also reached a record high in September.
Emerging markets were the top performing markets, gaining 5.9% over the month. These markets were led higher by the Chinese sharemarket (+21.1%) following the release of measures to stimulate the economy.
Reflecting the continued softness in the Chinese economy officials announced a raft of measures to stimulate the economy. These include China’s central bank cutting interest rates and injecting liquidity into the banking system. Simultaneously the Chinese government unveiled a US$110b package to boost the stock market by lending to asset managers, insurers and brokers to buy equities, and to listed companies to buy back their shares. These measures aim to boost consumer and business confidence primarily through stabilising the property market and pushing equity prices higher.
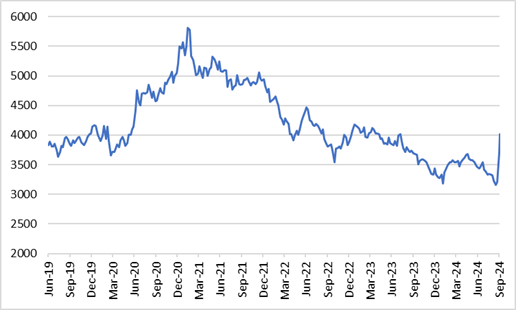
As a result, Chinese stocks experienced one of their best single day gains on record, the CSI China 300 Index rose 8.5%, its biggest daily gain since 2008. Over the last two weeks of the month the index rose 24%. As highlighted in the graph below, this comes after a prolonged period of underperformance.
CSI China 300 Index

Source: RBNZ, JMI Wealth
With June’s quarter corporate earnings season largely over, company news was light over the month. Escalating tensions in the Middle East created volatility late in the month. As a result, sharemarket returns were driven by stock specific factors. Boeing fell 12.5% in September due to industrial action at their plants. Caterpillar rose 9.8% as it was seen as a likely beneficiary of the Chinese economic stimulus package.
Larger cap stocks outperformed as the US Federal Reserve commenced interest rate reductions. The Magnificent 7 (Apple, Microsoft, Google parent Alphabet, Amazon, Nvidia, Meta Platforms and Tesla) as a group reversed July’s decline and accounted for 55.2% of the S&P 500 Index gains in September. The S&P 500 Index gained 2.1% in September.
The US utilities sector rose 6.4% over the month, being one of the better performing sectors, benefiting from lower interest rates and a more defensive earnings profile. Global Listed Infrastructure, a recent addition to the JMI model portfolios, returned 2.2% in September for similar reasons (New Zealand dollar hedged).
In New Zealand dollar terms global equities rose 0.7% over the month because of a stronger New Zealand dollar, which lessens returns from offshore assets. The New Zealand dollar gained 1.6% against the US dollar. This was partly about the US dollar weakening on lower interest rates and the New Zealand dollar gaining support as a “commodity” currency, benefiting from the Chinese economic package.
Australasian Equities
New Zealand’s share market [2] was flat over the month, as it digested the corporate earnings announcements from the previous month. September was dominated by corporate activity, Contact Energy made a $1.86 billion offer for Manawa Energy, and Auckland International Airport and Fletcher Building both raised capital, $1.4 billion and $700 million respectively.
The top performing companies over the month included Manawa Energy (+26.3%) on Contact’s takeover offer, Fonterra (13%) after a strong profit announcement and lifting their dividend, and A2 Milk (12.7%) after it announced it was considering a potential acquisition opportunity.
The challenging economic environment New Zealand companies are facing was confirmed with the release of economic growth data. The New Zealand economy contracted -0.2% over the three months ending June. Although slightly better than expected, it is consistent with the local economy having rolled in and out of recession for the last couple of years. The New Zealand economy has contracted in four of the last seven quarters. This has resulted in a build-up of spare capacity and falling inflation pressures. Over the last year the economy has contracted -0.5%. On a per capita basis, the economy is 2.7% lower than a year ago.
Australian equities gained 3.0% [3] in September, benefiting from higher commodity prices on the back of the Chinese economic stimulus package. Over the month Copper and Iron Ore rose 9.8% and 8.6% respectively. Amongst the larger stocks, resource companies Mineral Resources +29.6%, BHP +16.0%, and RIO Tinto +15.8% were the better performing companies. The more defensive sectors and banks underperformed as investors rotated out of these sectors in favor of resources. CBA and National Australia Bank fell -2.9% and -2.1% respectively. The weakness amongst the banks was unsurprising, coming after a period of strong relative performance and with them trading at extended valuations.
Fixed income and cash markets
Global bond yields drifted lower in September on benign inflation outcomes and expectations for ongoing interest rate reductions by central banks around the world.
The US Federal Reserve (Fed) lowered the Federal Funds Rate by 50 basis points to a target range of 4.75% - 5.00%, their first-interest rate reduction since March 2020 and first change in rates since increasing them by 25 basis points in July last year. The 50 basis points is large in the context of starting an interest rate easing cycle and given the current strength of the US economy. The Fed chair, Jerome Powell, repeatedly described the move as a policy “recalibration”.
As far as the outlook, Powell said the direction of interest rates was toward a more neutral level (2.9%), and the Fed will go faster or slower depending on how the data and risks unfold. The Fed’s median projection now shows another 50 basis points worth of cuts over the remaining two meetings of this year, followed by 100 basis points in 2025 and 50 basis points in 2026.
During the month the European Central Bank (ECB) cut interest rates by 25 basis points (0.25%) to 3.5%, the second-interest rate reduction in the easing cycle which began in June. The Bank of Canada reduced interest rates for a third consecutive time and raised concerns about the potential risks to economic growth and inflation undershooting their forecasts.
Over the month the US 10-year government bond yield fell 12 basis points (0.12%) to 3.78% over the month. The Bloomberg Global Aggregate Bond Index (New Zealand dollar hedged) returned 1.3% in September.
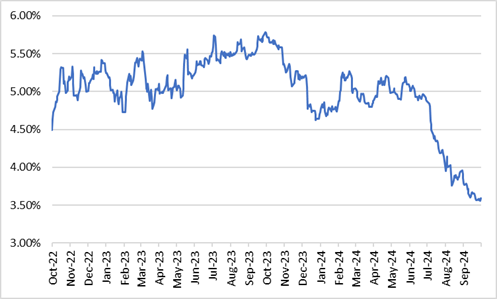
New Zealand’s interest rates fell on global events and in anticipation of the Reserve Bank of New Zealand’s (RBNZ) continued reductions in interest rates. New Zealand’s 2-year swap rate fell 37 basis points to 3.57% over the month.
New Zealand’s 2-year swap rate

Source: RBNZ, JMI Wealth
The 2-year swap rate is considered most sensitive to changes in the RBNZ’s interest rate policy. As highlighted in the above graph, domestic interest rates have fallen dramatically over the last three months. The RBNZ anticipate the Official Cash Rate to be at 3.8% by the end of 2025. With the recent decline in interest rates, the market has largely priced in the anticipated easing of interest rates by the RBNZ.
The local fixed income market [4] rose 0.6% for the month and is up 11.3% over the last twelve months.
Conclusion
The RBNZ is anticipated to cut interest rates aggressively over the months ahead. Further reductions in short-term interest rates and the likelihood that domestic corporate earnings are at cyclical lows provides the opportunity for the local sharemarket to outperform in the year ahead.
The relative attractiveness of domestic bonds has declined given the dramatic decline in longer-term interest rates over the last three months. The anticipated decline in shorter term domestic interest rates in the months ahead is negative for people looking at term deposits to provide them with income.
Global bonds continue to offer stability of income and the potential for capital gains from further reductions in interest rates as inflation continues to decline and central banks progress interest rate cuts.
With the US labour market softening the risks of recession have risen. However, at this stage this appears to be a normalising of the US labour market, and the economy remains on track for a soft landing. On a longer-term view, a reduction in interest rates will be positive for global sharemarkets.
The current environment remains constructive for both fixed income and equity markets. This provides a favourable backdrop for a well-diversified balanced portfolio. In this environment, we recommend investors continue to focus on their long-term goals while acknowledging that in the short-term returns may be volatile. In time, this approach should reward investors.
1 MSCI ACWI Index in local currencies
2 S&P NZX 50 gross index
3 S&P ASX 200 total return Index
4 Bloomberg NZ Bond Composite 0+ Yr Index
Indices for Key Markets
| As at 30 September 2024 | 1 Month | 3 Months | 6 Months | 1 Year | 3 Years p.a. | 5 Years p.a. |
| S&P/NZX 50 Index | 0.0% | 6.4% | 3.0% | 10.8% | -1.4% | 3.4% |
| S&P/ASX 200 Index (AUD) | 3.0% | 7.8% | 6.7% | 21.8% | 8.4% | 8.4% |
| MSCI ACWI Index (Local Currency) | 2.0% | 5.0% | 8.5% | 30.0% | 9.1% | 12.5% |
| MSCI ACWI Index (NZD) | 0.7% | 2.5% | 3.5% | 24.8% | 11.1% | 11.9% |
| S&P/NZX 90 Day bank bill Total Return | 0.5% | 1.4% | 2.9% | 5.8% | 4.0% | 2.6% |
If you have any questions please contact us on +64 9 308 1450
Information and Disclaimer: This report is for information purposes only. It does not take into account your investment needs or personal circumstances and so is not intended to be viewed as investment or financial advice. Should you require financial advice you should always speak to your Financial Adviser. This report has been prepared from published information and other sources believed to be reliable, accurate and complete at the time of preparation. While every effort has been made to ensure accuracy neither JMI Wealth, nor any person involved in this publication, accept any liability for any errors or omission, nor accepts liability for loss or damage as a result of any reliance on the information presented.